
The 1-point scoring system, also known as the win/loss system, is one of the most common scoring methods used in pool leagues. Players earn one (1) point for winning each game and the loser gets zero (0).
Advantages
Scoring is easy. The score of each game is determined simply by who won and lost. There is no need to track balls, innings, safeties, or anything else during or after each game.
Disadvantages
You do not earn points when you lose a game. Even if you play well and make several balls, you get zero (0) points if you lose the game, which can be discouraging. Also, each player carries an "average" which is often used for handicapping. These averages are sometimes not a true reflection of skill and not comparable from region to region. These problems are discussed in greater detail below.
The Old Way
Traditionally, players earned an average calculated as (Total Games Won - Total Games Lost) / Weeks Played. For example, if a league has 5-player teams, plays a round-robin format and each person plays five (5) games in the match, averages would range from +5 to -5 and be calculated as shown below.
|
Player Average Examples after Week 1
5-0: (5 wins - 0 losses) / 1 week = +5 4-1: (4 wins - 1 loss) / 1 week = +3 3-2: (3 wins - 2 losses) / 1 week = +1 2-3: (2 wins - 3 losses) / 1 week = -1 1-4: (1 win - 4 losses) / 1 week = -3 0-5: (0 wins - 5 losses) / 1 week = -5 |
NOTE: In this example, each person plays five (5) games per match and therefore, player averages range from -5 to +5. If each person played a different number of games per match, player averages would range from negative to positive of that number.
|
|
Player Average Examples after Week 2
10-0: (10 wins - 0 losses) / 2 weeks = +5 9-1: (9 wins - 1 loss) / 2 weeks = +4 8-2: (8 wins - 2 losses) / 2 weeks = +3 7-3: (7 wins - 3 losses) / 2 weeks = +2 6-4: (6 wins - 4 losses) / 2 weeks = +1 5-5: (5 wins - 5 losses) / 2 weeks = 0 4-6: (4 wins - 6 losses) / 2 weeks = -1 3-7: (3 wins - 7 losses) / 2 weeks = -2 2-8: (2 wins - 8 losses) / 2 weeks = -3 1-9: (1 win - 9 losses) / 2 weeks = -4 0-10: (0 wins - 10 losses) / 2 weeks = -5 |
NOTE: In this example, each person plays five (5) games per match and therefore, player averages range from -5 to +5. If each person played a different number of games per match, player averages would range from negative to positive of that number.
|
Each team member's average is added to establish a team total. When two teams play, the difference in their totals is the handicap. See the example below. Team A has a total of -1 while Team B has a total of +5. Because Team B's total is six (6) points higher, Team A would get six (6) points added to its total score as a handicap.
|
TEAM A Player 1: +2 Player 2: 0 Player 3: +1 Player 4: -3 Player 5: -1 Total: -1 |
TEAM B Player 1: +4 Player 2: +2 Player 3: +1 Player 4: -1 Player 5: -1 Total: +5 |
HANDICAP Team A: -1 Team B: +5 6 pts. |
This method works reasonably well but has some flaws. First, a person's average is not always a true reflection of his or her skill. If a person plays more higher-skilled players, his or her average will tend to be lower. If that same person plays more beginning and social players, his or her average will tend to be higher. It's the same person but a different average depending on the skill level of past competitors.
Also, averages in different leagues and regions are often not comparable. An average of +3 in Los Angeles, California is likely not the same as an average of +3 in Pollard, Kansas. The populations and talent pools are just too different.
Also, averages in different leagues and regions are often not comparable. An average of +3 in Los Angeles, California is likely not the same as an average of +3 in Pollard, Kansas. The populations and talent pools are just too different.
A Better Way Using FargoRate
FargoRate fixes these problems. Leagues can continue using the 1-point (win/loss) system for scoring while utilizing FargoRate for ratings and handicapping. Here's how.
Using the Fargo ratings of each team's players, FargoRate can calculate a handicap that gives both teams as close to an even chance as possible. Although FargoRate will provide a suggested handicap per round or per match, we recommend handicapping by match when using the 1-point scoring method.
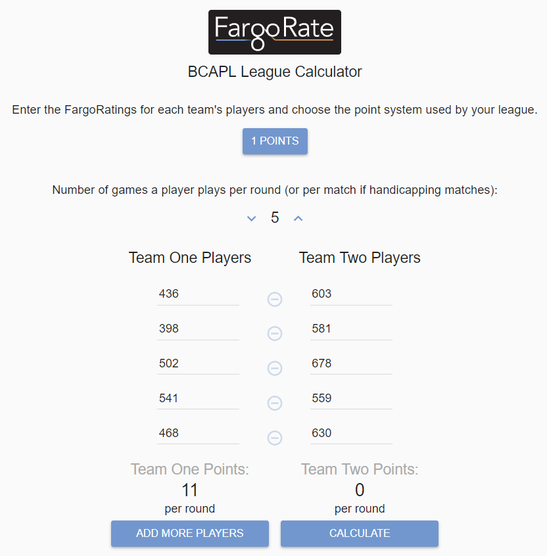
See the example below. Using the BCAPL League Calculator located at http://leaguecalc.fargorate.com, enter the ratings of every player on each team. In this scenario, there are two 5-player teams playing a round robin format where each person plays one game per round and five (5) rounds. The result is "Team One" gets an 11-point handicap in this 25-game match.
Using the Fargo ratings of each team's players, FargoRate can calculate a handicap that gives both teams as close to an even chance as possible. Although FargoRate will provide a suggested handicap per round or per match, we recommend handicapping by match when using the 1-point scoring method.
See the example below. Using the BCAPL League Calculator located at http://leaguecalc.fargorate.com, enter the ratings of every player on each team. In this scenario, there are two 5-player teams playing a round robin format where each person plays one game per round and five (5) rounds. The result is "Team One" gets an 11-point handicap in this 25-game match.
When entering scores in the FargoRate League Management System (LMS), these calculations are automatic. Additionally, FargoRate is developing an LMS mobile scoring app that will make all of this seamless and allow teams to score matches on their phones or tablets and submit them directly to LMS.
Summary
The 1-point scoring system is great for league play and we can now make it even better. You no longer have to tolerate unreliable averages and inaccurate handicaps. You can keep the advantages of the 1-point scoring system while using FargoRate to make ratings and handicaps more accurate. The result is more competitive leagues with more teams in contention and more players returning session to session.
For more information about how FargoRate and LMS can help your league, contact us at 702-719-POOL (7665).
For more information about how FargoRate and LMS can help your league, contact us at 702-719-POOL (7665).